
A DataFrame is the primary data structure of the Pandas library and is commonly used for storing and working with tabular data. A common operation that could be performed on such data is to count the frequency that a value occurs in a dataframe column in order to extract more information from the DataFrame.
To start working with Pandas, we first need to import this statement in the Python code :
import pandas as pd
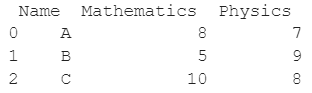
Let us understand this operation with the help of an example. Consider the following DataFrame containing 3 students with names A, B and C and their corresponding marks (out of 10) for two subjects, Mathematics and Physics.
Python code snippet for generating the above DataFrame :
# Importing pandas
import pandas as pd

# Dictionary for our data
data = {'Name' : ['A', 'B', 'C'], 'Mathematics' : [8, 5, 10], 'Physics' : [7, 9, 8]}

# DataFrame for the dictionary
df = pd.DataFrame(data)

# Printing the DataFrame
print(df)
Here, data is a dictionary we created to initialize the DataFrame. For this, we use the DataFrame() function of the Pandas library which takes the dictionary as an argument and returns the required DataFrame.
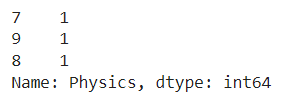
Now, let’s say that for some reason, we need to count the frequency that a value occurs in a column. Assume the column of interest is physics. Since there is 1 occurrence of each 7,8 and 9 in the physics column, the resulting output would look like this :
Let us look at different ways of performing this operation on a given DataFrame :
This method is pretty straightforward and is the most commonly used one. In this method, we use the dataframe.value_counts() function to count the frequency that a value occurs in a dataframe column of interest, here Physics. Here, df[‘Physics’] is used to access the column with the label Physics in the DataFrame.
Let us look at the Python code and corresponding output for this method
# Importing pandas
import pandas as pd

# Dictionary for our data
data = {'Name' : ['A', 'B', 'C'], 'Mathematics' : [8, 5, 10], 'Physics' : [7, 9, 8]}

# DataFrame for the dictionary
df = pd.DataFrame(data)

# Performing the operation and printing output
print(df['Physics'].value_counts())
Output :
Another way to perform the same operation would be to use df.Physics to access the column labeled as Physics instead of using df[‘Physics’]. Let us look at the Python code and corresponding output for this method
# Importing pandas
import pandas as pd

# Dictionary for our data
data = {'Name' : ['A', 'B', 'C'], 'Mathematics' : [8, 5, 10], 'Physics' : [7, 9, 8]}

# DataFrame for the dictionary
df = pd.DataFrame(data)

# Performing the operation and printing output
print(df.Physics.value_counts())
Output :
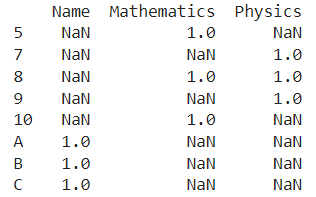
This method is an alternative method to the previous one. In this method we use the dataframe.apply() function to count the frequency that a value occurs in a dataframe column.
The function to be applied as shown in the previous method, pd.value_counts is passed as a parameter here and the result is printed.
Let us look at the Python code and corresponding output for this method.
# Importing pandas
import pandas as pd

# Dictionary for our data
data = {'Name' : ['A', 'B', 'C'], 'Mathematics' : [8, 5, 10], 'Physics' : [7, 9, 8]}

# DataFrame for the dictionary
df = pd.DataFrame(data)

# Performing the operation and printing output
print(df.apply(pd.value_counts))
Output :
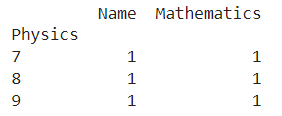
This method is an alternative method to the previous ones. In this method, we use the dataframe.groupby() function to count the frequency that a value occurs in a dataframe column.
First, the column of interest, Physics here is passed as a parameter, the dataframe.count() function is applied and the result is printed.
Let us look at the Python code and corresponding output for this method.
# Importing pandas
import pandas as pd

# Dictionary for our data
data = {'Name' : ['A', 'B', 'C'], 'Mathematics' : [8, 5, 10], 'Physics' : [7, 9, 8]}

# DataFrame for the dictionary
df = pd.DataFrame(data)

# Performing the operation and printing output
print(df.groupby('Physics').count())
Output :
In this topic, we have learned how to Count the frequency that a value occurs in a dataframe column in an existing Pandas DataFrame, following a running example of test scores of students in different subjects, thus giving us an intuition of how this concept could be applied in real-world situations. Feel free to reach out to info.javaexercise@gmail.com in case of any suggestions.